4.8. Dual Axis Chart#
import pandas as pd
import matplotlib.pyplot as plt
data = {'Month':['Jan','Feb','March','April'],
        'Sales': [99, 98, 95, 90],
        'Profit': [10,20,30,40]
       }
df=pd.DataFrame(data,columns=['Sales','Profit'],index=data['Month'])
df
| Sales | Profit | |
|---|---|---|
| Jan | 99 | 10 |
| Feb | 98 | 20 |
| March | 95 | 30 |
| April | 90 | 40 |
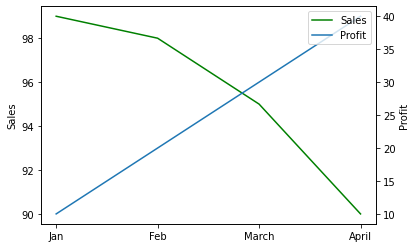
4.8.1. Dual Axis Line Chart#
When one column’s number is too large and other column’s number if too small
How you create dual axis is create second axis using twin() and create plot on that axis
fig,ax=plt.subplots()
ax.plot(df.index,df['Sales'],label='Sales',color='green')
ax.set_ylabel('Sales')

ax2=ax.twinx()
ax2.plot(df.index,df['Profit'],label='Profit')
ax2.set_ylabel('Profit')
fig.legend(['Sales','Profit'],bbox_to_anchor=(.9,.88))
<matplotlib.legend.Legend at 0x7fea640db1c0>