4.2. Rules of Object Oriented Matplotlib#
import pandas as pd
import matplotlib.pyplot as plt
4.2.1. Example 1 - Without defining Axis#
If you want to be quick and do not want to define axis manually and just want to do ax.plot(df), you will need to structure your df in specific way
By default, index is taken as x axis
So, you will need to change the index of your df to whatever column you want as x axis
There should be no other categorical variable
All the numerical columns will be plotted as separate lines
data = {'Month':['Jan','Feb','March','April'],
        'Sales': [99, 98, 95, 90],
        'Profit': [10,20,30,40]
       }
df=pd.DataFrame(data,columns=['Sales','Profit'],index=data['Month'])
df

# See how I changed the structure of dataframe in pd.dataframe
| Sales | Profit | |
|---|---|---|
| Jan | 99 | 10 |
| Feb | 98 | 20 |
| March | 95 | 30 |
| April | 90 | 40 |
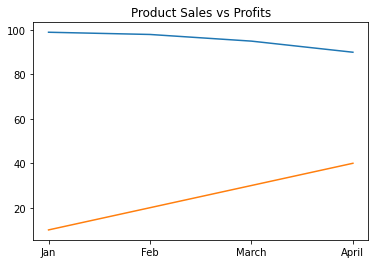
fig,ax=plt.subplots()
ax.plot(df)
ax.set_title('Product Sales vs Profits')
Text(0.5, 1.0, 'Product Sales vs Profits')
4.2.2. Example 2 - Manually defining Axis#
data = {'Subject': ['A', 'B', 'C', 'D'],
        'SahilMarks': [99, 98, 95, 90],
        'SoniaMarks': [10,20,30,40]
       }
df=pd.DataFrame(data)
df
| Subject | SahilMarks | SoniaMarks | |
|---|---|---|---|
| 0 | A | 99 | 10 |
| 1 | B | 98 | 20 |
| 2 | C | 95 | 30 |
| 3 | D | 90 | 40 |
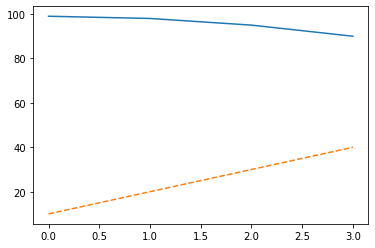
fig,ax=plt.subplots()
ax.plot(df.index,df['SahilMarks']) # Manually giving x axis
ax.plot(df.index,df['SoniaMarks'],ls='--') # Manually giving y axis

# Note, if you don't provide axis, directly use ax.plot(df) ->
    # Index becomes x axis
    # remaining number column becomes y axis
    # Fails if more than one number column so its better to define manually
[<matplotlib.lines.Line2D at 0x7f8a8c19b9d0>]
4.2.3. Summary#
If you want quick analysis, pass entire df to ax.plot()
If you want customizations of each line, declare them separately and plot each of them separately using ax.plot() multiple times
Pro Tip: Lets say you want different line for each country then you will need different column for different countries (since lines are columns in matplotlib) so pivoting is required for that and keep index as your only dimension (Keep only One dimension)