2. Compatible Data Types#
We can use
Python lists
Numpy arrays
Pandas Series & Dataframes
import matplotlib.pyplot as plt
import numpy as np
import pandas as pd
2.1. Python lists#
plt.plot([1,2,3,4,5,])
[<matplotlib.lines.Line2D at 0x7f83203da3a0>]
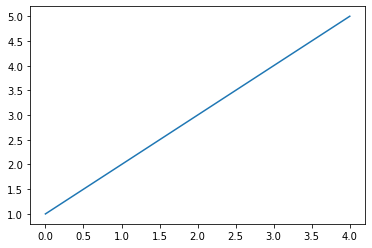
2.2. Numpy array#
plt.plot(np.array([1,2,3,4,5]))
[<matplotlib.lines.Line2D at 0x7f83180719a0>]
2.3. Pandas Series#
plt.plot(pd.Series([1,2,3,4,5]))
[<matplotlib.lines.Line2D at 0x7f83181761c0>]
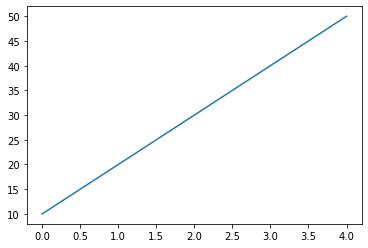
2.4. Pandas Dataframe#
In case of Dataframe
Each column will be plotted as separate line
Index of Dataframe becomes x axis
col = [10,20,30,40,50]
df=pd.DataFrame(data=col)
df
| 0 | |
|---|---|
| 0 | 10 |
| 1 | 20 |
| 2 | 30 |
| 3 | 40 |
| 4 | 50 |
plt.plot(df)
[<matplotlib.lines.Line2D at 0x7f83181f7130>]