9. Pairplot#
Find relationship between numerical variables
Note: Its not useful to scatterplot x variable with xx variable
So in these cases, histogram is plotted automatically instead of line plot
import seaborn as sns
import pandas as pd
data = {'Month':['Jan','Jan','March','April','Jan','Jan','March','April','Jan','Jan','March','April'],
        'Sales': [99, 102, 905, 120,12,12,12,22,12,12,12,430],
        'Profit': [9, 12, 905, 120,120,12,102,22,192,12,12,40],
        'Discount': [9, 12, 905, 120,120,12,102,22,192,12,12,40]
       }
df=pd.DataFrame(data)
sns.pairplot(df
);
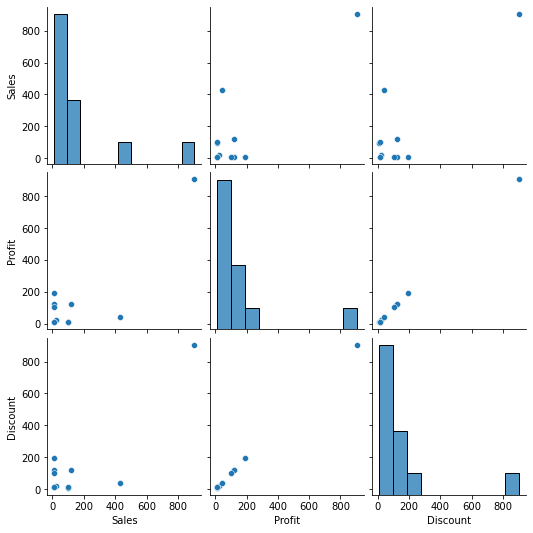
We can see that Discount and Profit are directly proportional