8. Boxplot#
Used to find outliers
import seaborn as sns
import pandas as pd
data = {'Month':['Jan','Jan','March','April','Jan','Jan','March','April','Jan','Jan','March','April'],
        'Sales': [99, 102, 905, 120,12,12,12,22,12,12,12,430]
       }
df=pd.DataFrame(data)
sns.boxplot(
x='Sales',
data=df,
);

8.1. Basic Stats#
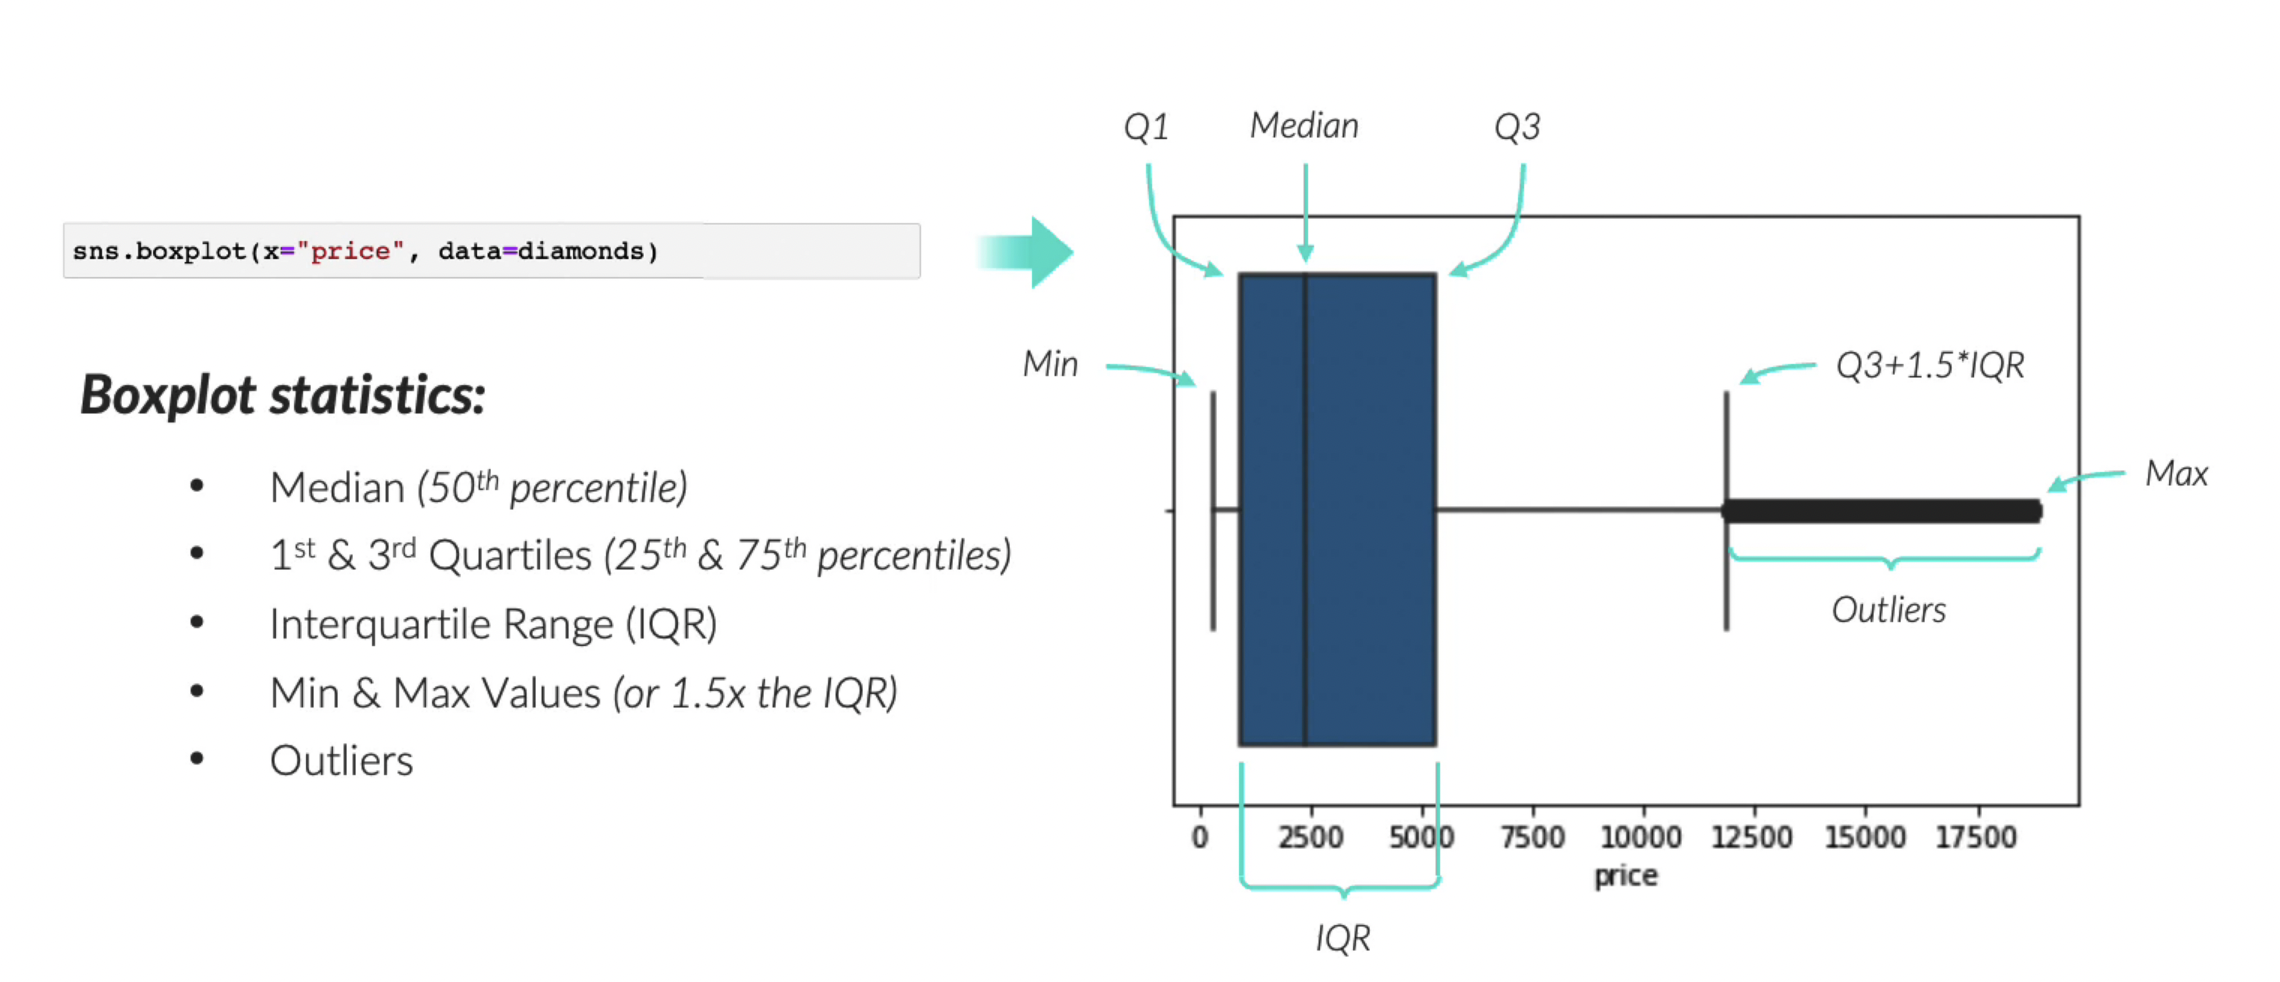
Median - 50 Percentile
1st and 3rd Quartiles (25th & 75th percentiles) ( Most important !!)
50%
50 percent of data will be inside this box (inside Q1 and Q3)
IQR = difference between this Q1 & Q3