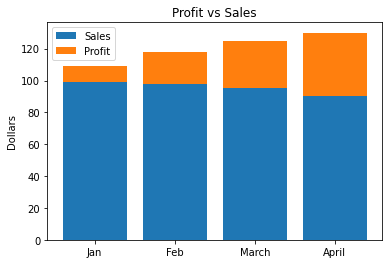
4.6. Stacked Bar Chart#
Set the bottom argument for second bar as the values of first bar
import pandas as pd
import matplotlib.pyplot as plt
data = {'Month':['Jan','Feb','March','April'],
        'Sales': [99, 98, 95, 90],
        'Profit': [10,20,30,40]
       }
df=pd.DataFrame(data,columns=['Sales','Profit'],index=data['Month'])
df
| Sales | Profit | |
|---|---|---|
| Jan | 99 | 10 |
| Feb | 98 | 20 |
| March | 95 | 30 |
| April | 90 | 40 |
fig,ax=plt.subplots()
ax.bar(df.index,
       df['Sales'],
      label='Sales')

ax.bar(df.index,
       df['Profit'],
      bottom=df['Sales'],
      label='Profit')

ax.set_title('Profit vs Sales')
ax.set_ylabel('Dollars')
ax.legend()
<matplotlib.legend.Legend at 0x7ff4635976d0>