1. Seaborn#
Matplotlib but on Steroids
Python library that quickens the process of visualization
Built on top on matplot lib
Old charts like Bar charts, line charts( that too quicker)
New charts like Box Plots, Violin Charts
2. Standardized format to create charts#
You just need to pass the dataframe as data and specify what are the x and y axis required
Aggregation will be automatic
import seaborn as sns
import pandas as pd
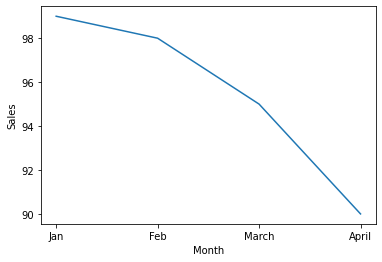
data = {'Month':['Jan','Feb','March','April'],
'Sales': [99, 98, 95, 90],
'Profit': [10,20,30,40]
}
# df=pd.DataFrame(data,columns=['Sales','Profit'],index=data['Month'])
# See above dataframe was for matplotlib, and it required customizations
# like you have to specify x axis in index
# you have to have only one categorical column in dataframe and much more
df=pd.DataFrame(data)
# No such things in Seaborn
# No Dataprep needed in Seaborn
sns.lineplot(
x='Month',
y='Sales',
data=df,
estimator=sum, # optional : aggregation can be changed as well
);
# See we didn't even passed labels still they appread automatically