4.7. Pie Chart#
Try to keep slices low
Group ‘others’ into single slice
import pandas as pd
import matplotlib.pyplot as plt
data = {'Month':['Jan','Feb','March','April'],
        'Sales': [99, 98, 95, 90],
        'Profit': [10,20,30,40]
       }
df=pd.DataFrame(data,columns=['Sales','Profit'],index=data['Month'])
df
| Sales | Profit | |
|---|---|---|
| Jan | 99 | 10 |
| Feb | 98 | 20 |
| March | 95 | 30 |
| April | 90 | 40 |
fig,ax=plt.subplots()
ax.pie(df['Sales']) ;

4.7.1. Customizations#
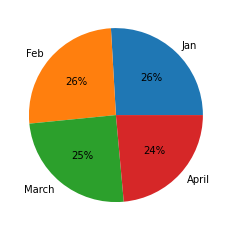
fig,ax=plt.subplots()
ax.pie(df['Sales'],
      labels=df.index,
      autopct='%.0f%%') ;