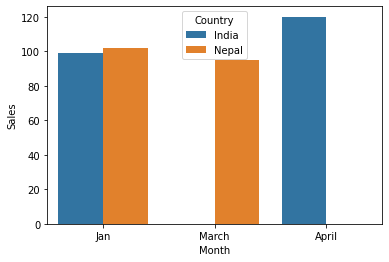
6. Grouped Bar chart#
Specify the categorical Column in ‘hue’
import seaborn as sns
import pandas as pd
data = {'Month':['Jan','Jan','March','April'],
        'Sales': [99, 102, 95, 120],
        'Profit': [10,20,30,40],
        'Country': ['India','Nepal','Nepal','India']
       }
df=pd.DataFrame(data)
sns.barplot(
x='Month',
y='Sales',
data=df.sort_values(by='Profit'), # Sorting the data in charts
hue='Country'
);